
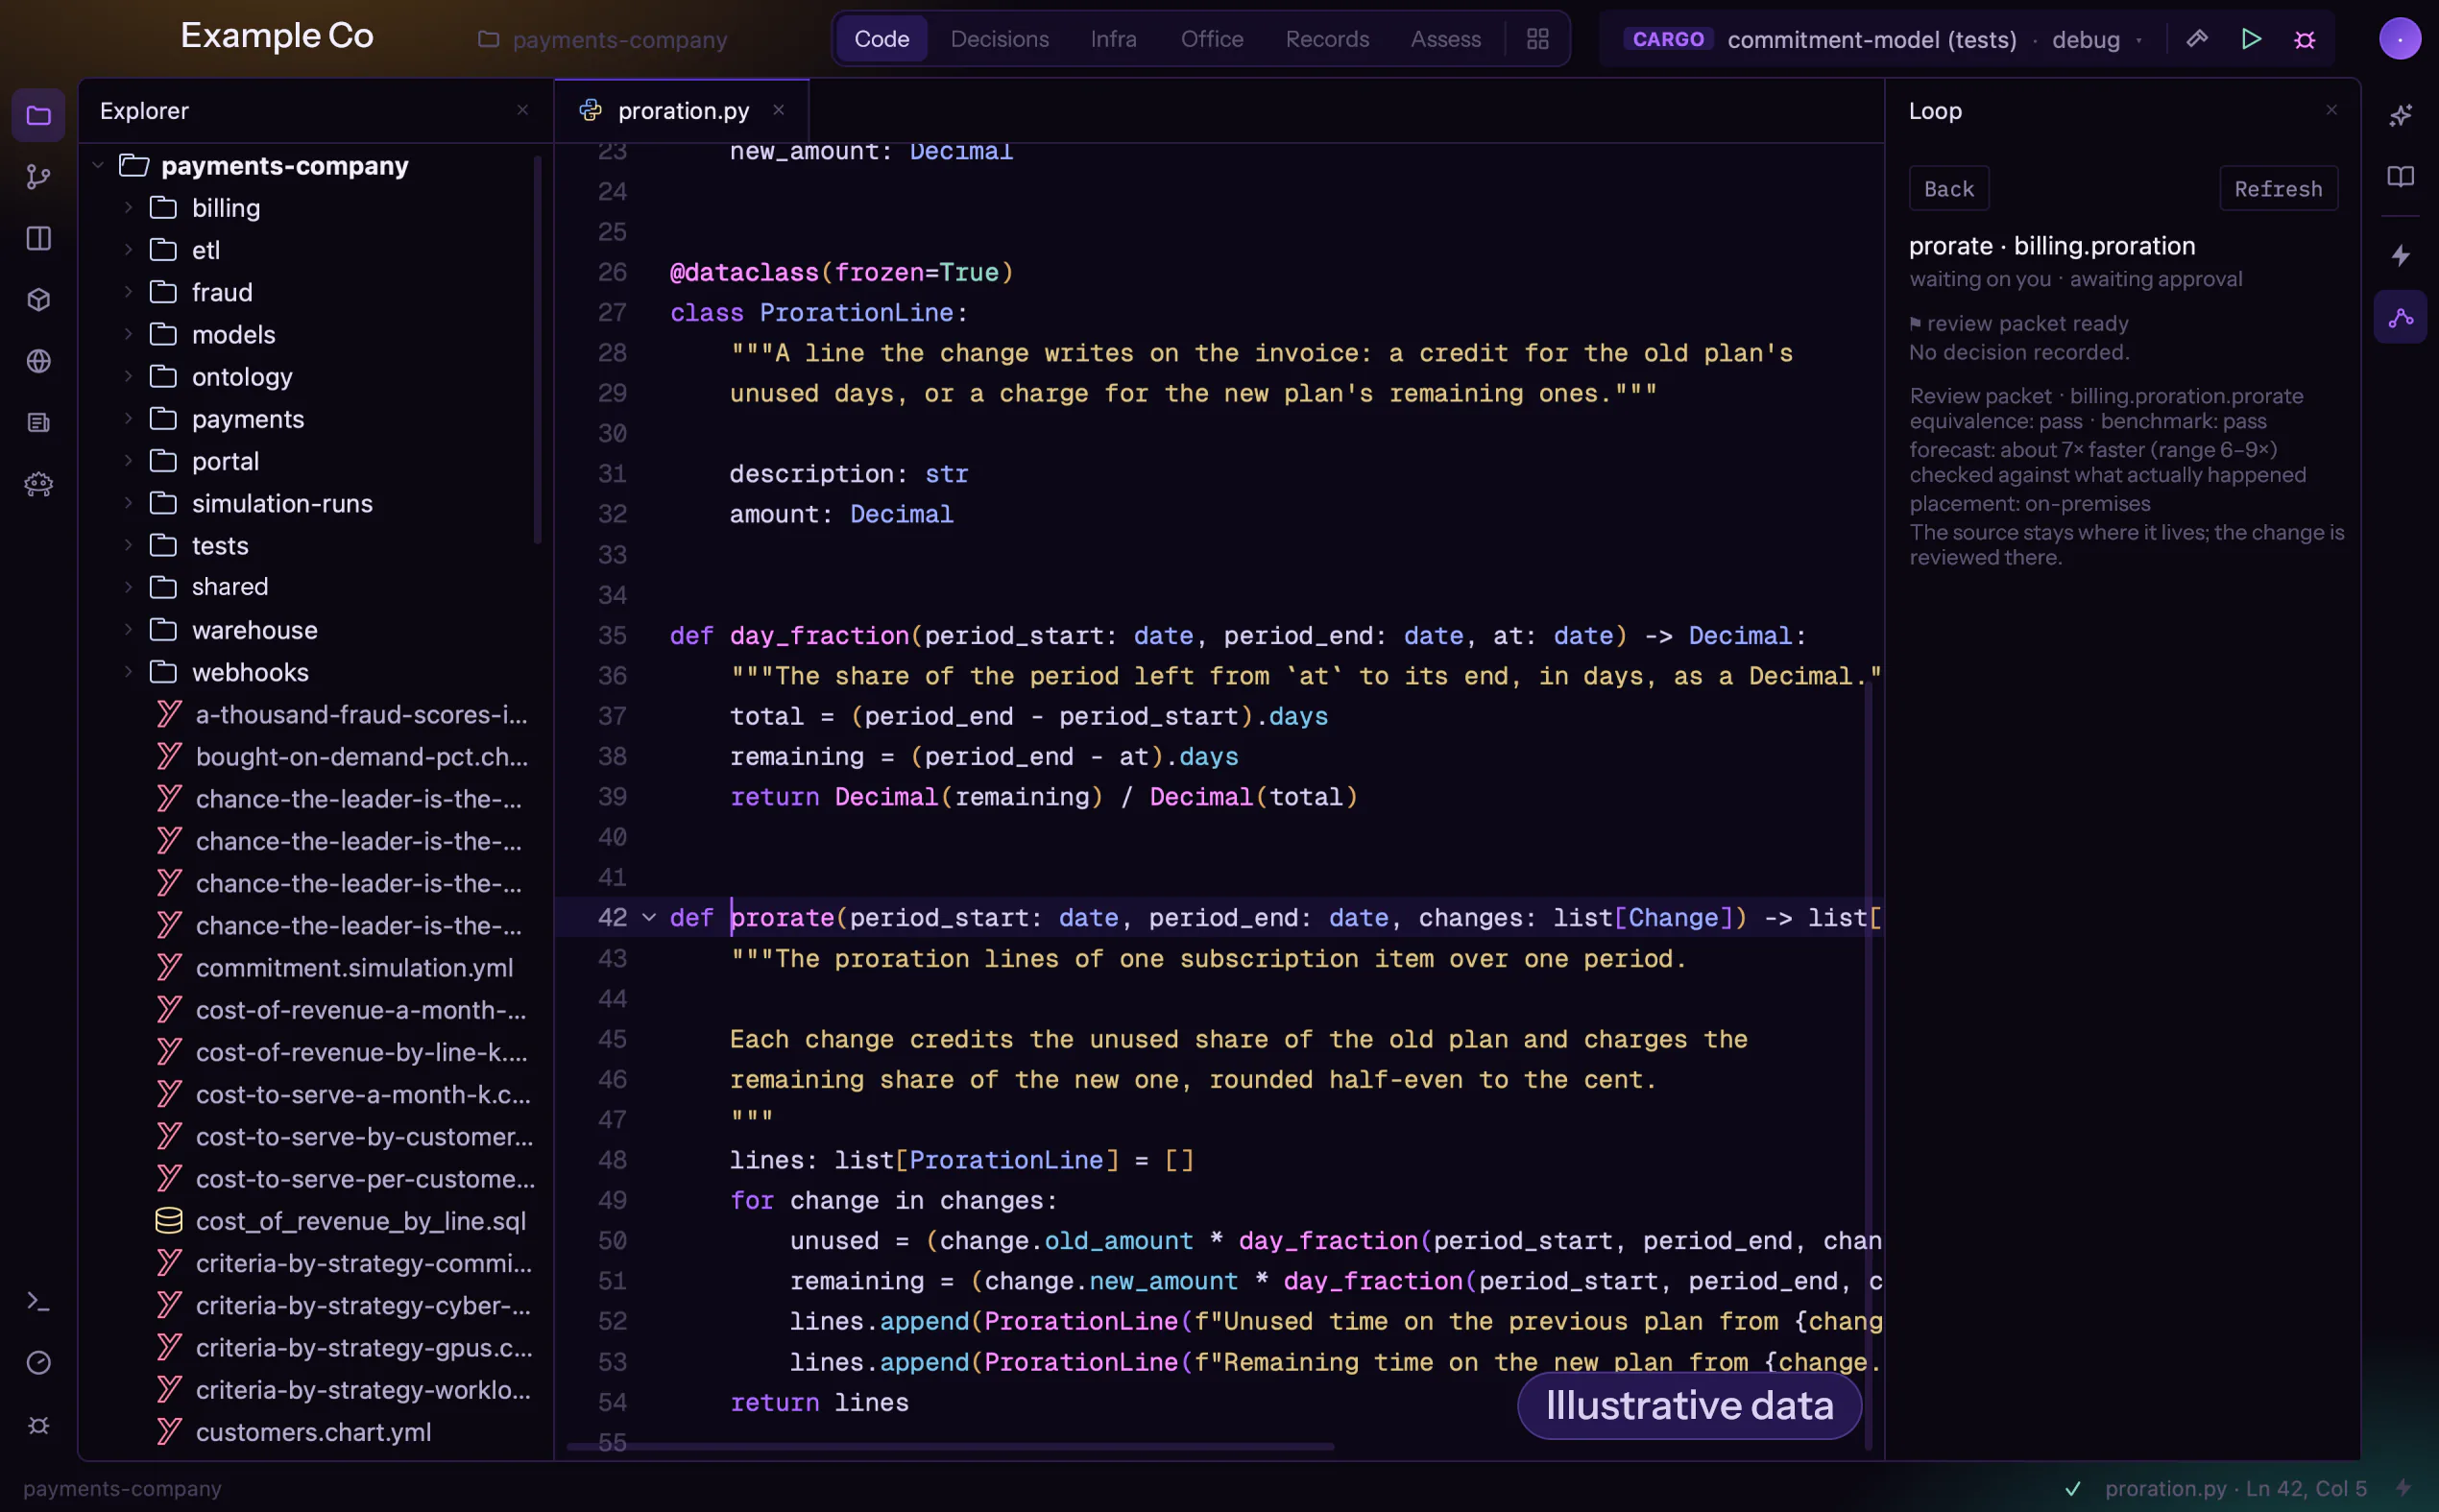
From the hotspot to the rollout, in one window
Cost lives in one tool, latency in another, the code in a third, and the AI agent in a chat window that has never seen a production number. The fix happens by intuition and ships by hope.
The workbench is a native editor with the loop built in: production hotspots ranked by what they cost, any Agent Client Protocol agent behind typed tools and a permission boundary, benchmark receipts and a deploy panel that pins to shadow first.
What you get
- The hotspot list in the editor: calls per day, peak CPU, failure rate, p95, priced.
- One click hands a unit to an agent; every tool call is typed and approved by policy.
- A benchmark receipt per kernel, approved by a person.
- Deploy to shadow, apply the pin, roll back, from the same panel, with the receipt attached.
How it works
We connect the telemetry.
The assessment's feed lands in the workbench: functions, tasks and instances with their cost.
Your team works the list.
In the editor, with the agent of their choice, inside the permission boundary you set.
Receipts gate the rollout.
Nothing deploys without an approved receipt; promotion is a separate, guarded step.
BEFORE YOU START
Before you start
Do we have to switch editors?
No. The loop also works from the editor and the agents your team already uses. The workbench is where it is fastest, not the only place it runs.
Which agents?
Any agent that speaks the Agent Client Protocol, all behind the same typed tools and permission boundary.
Where does the code run?
On your machines. The workbench is native on macOS, Windows and Linux, and runs in the browser; agents act inside sandboxes you approve.
Give the team the list, not the guess.
Book the assessment and see your own hotspots in the workbench in the first week.