Static, backward-looking plans miss the feedback loops that drive overruns and panic buying. By the time a shortfall shows in a report, the cheap decision window has closed.
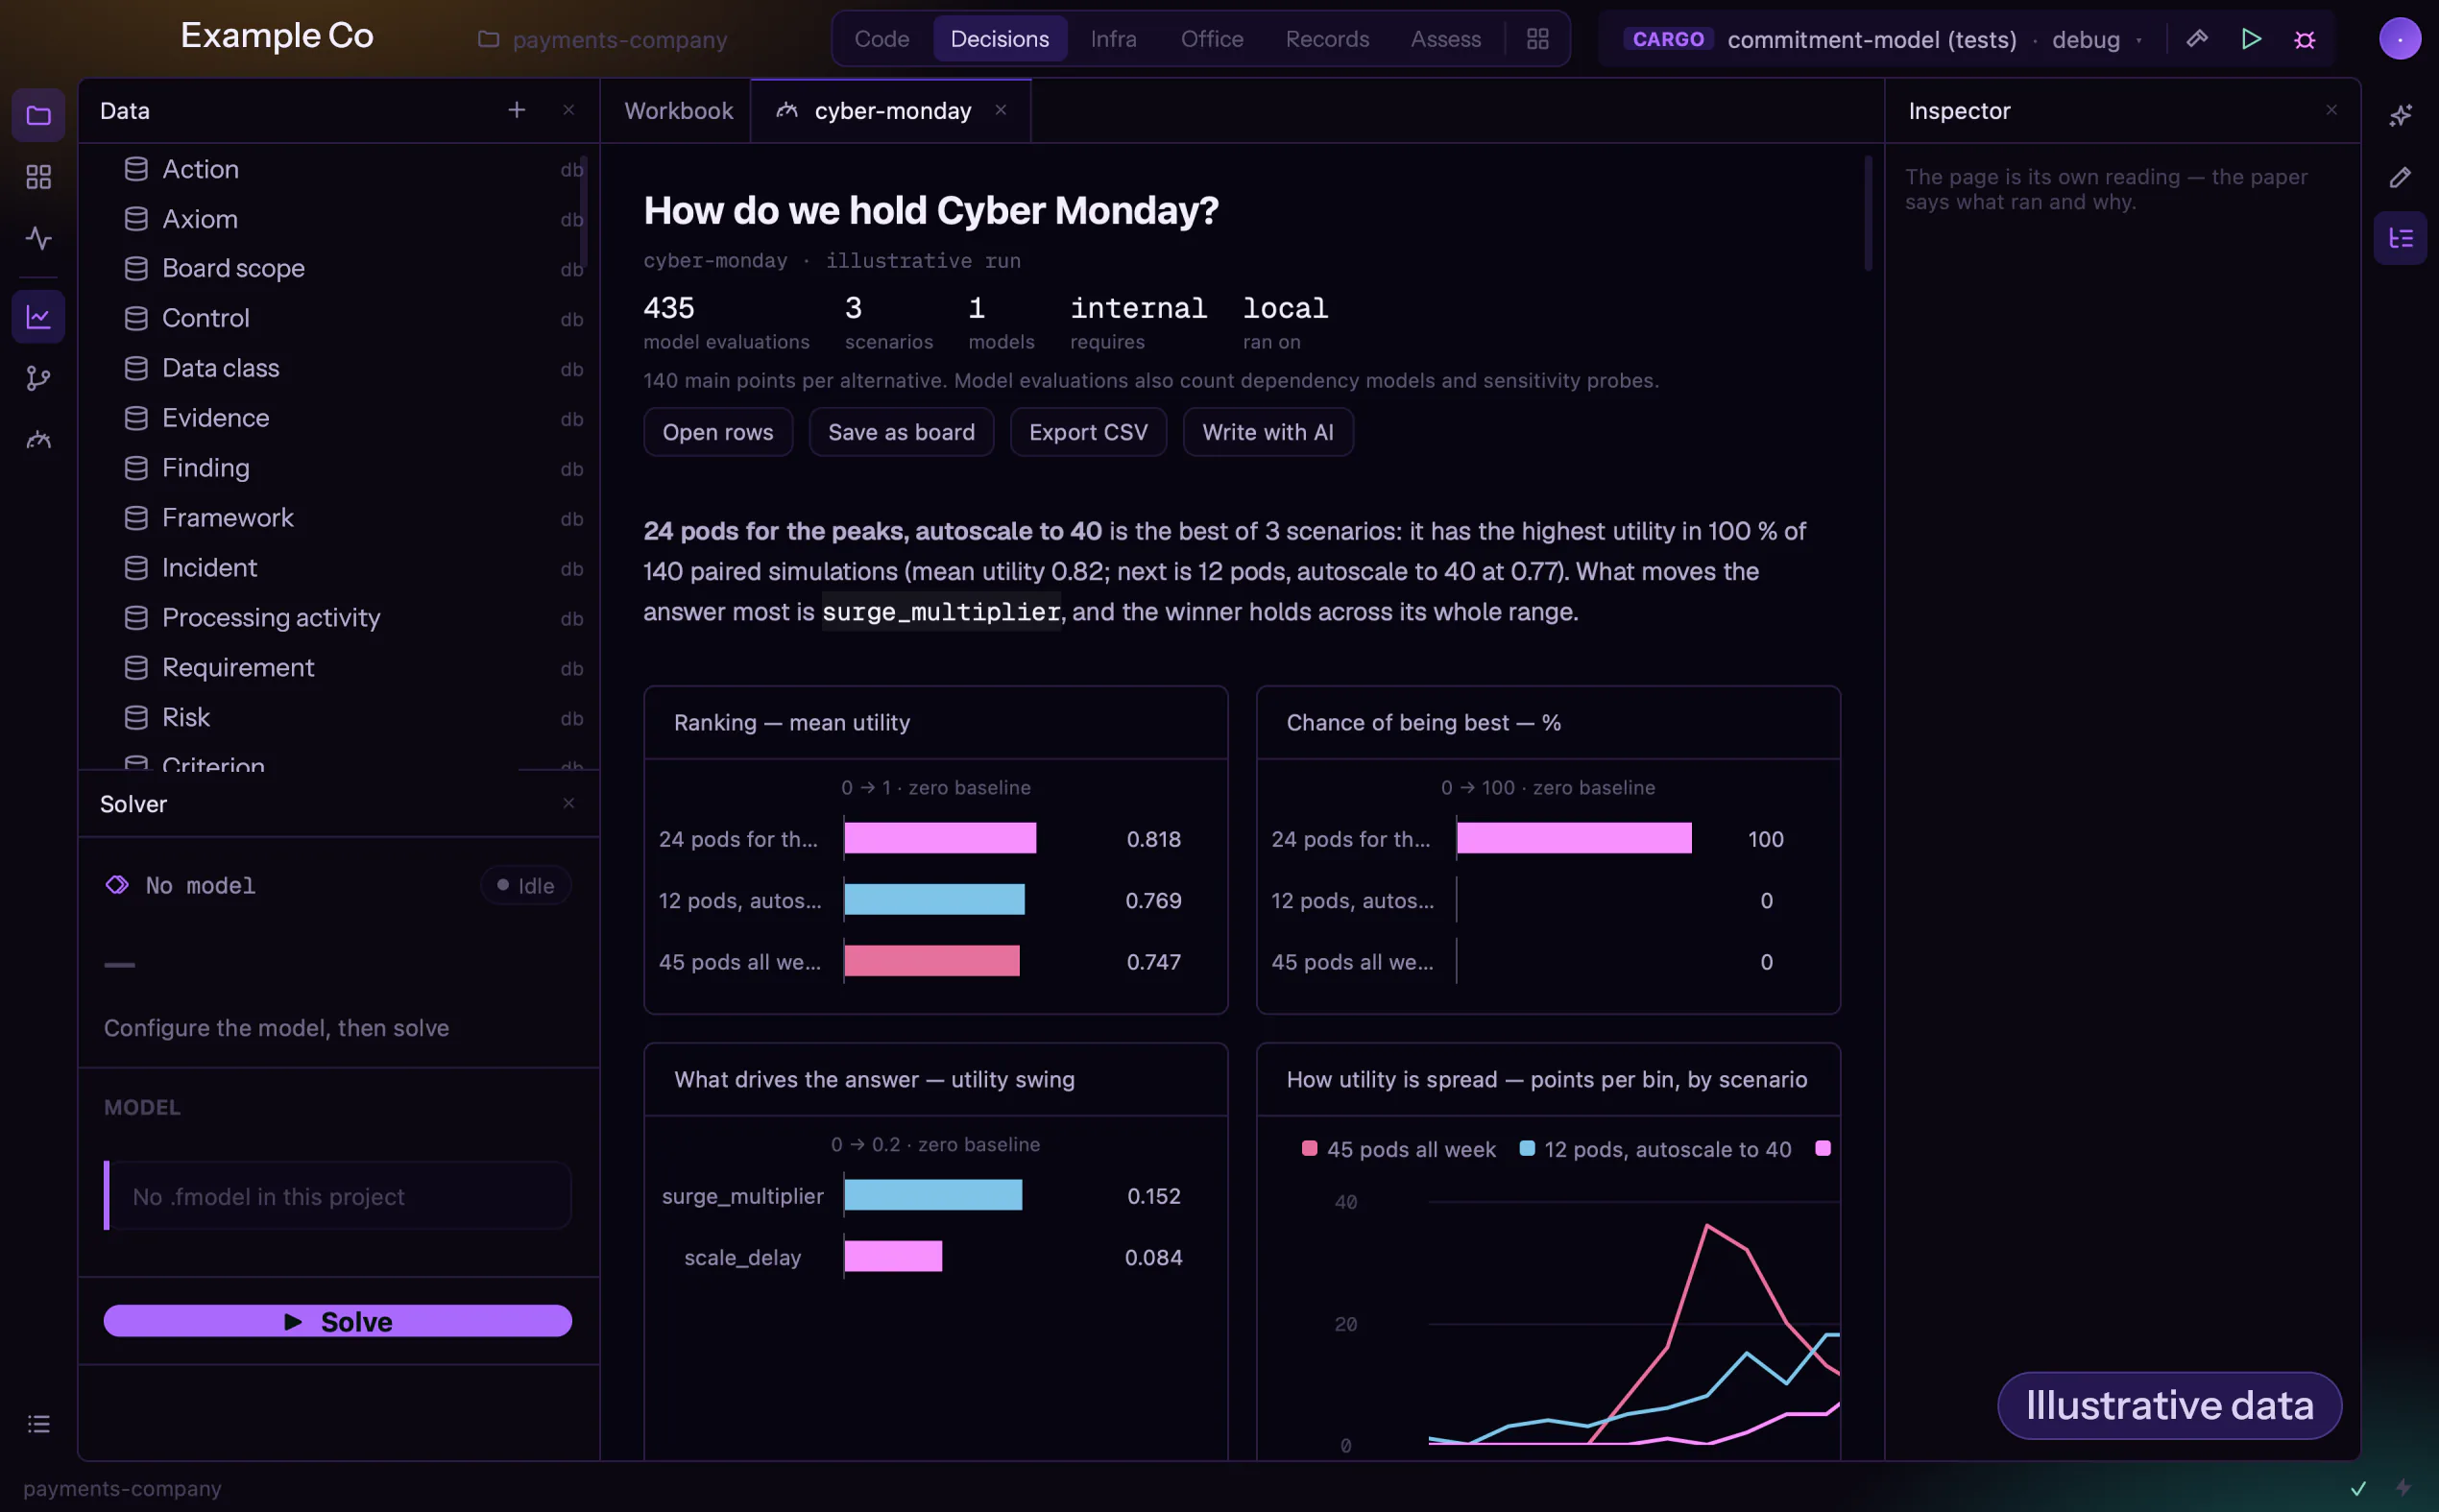
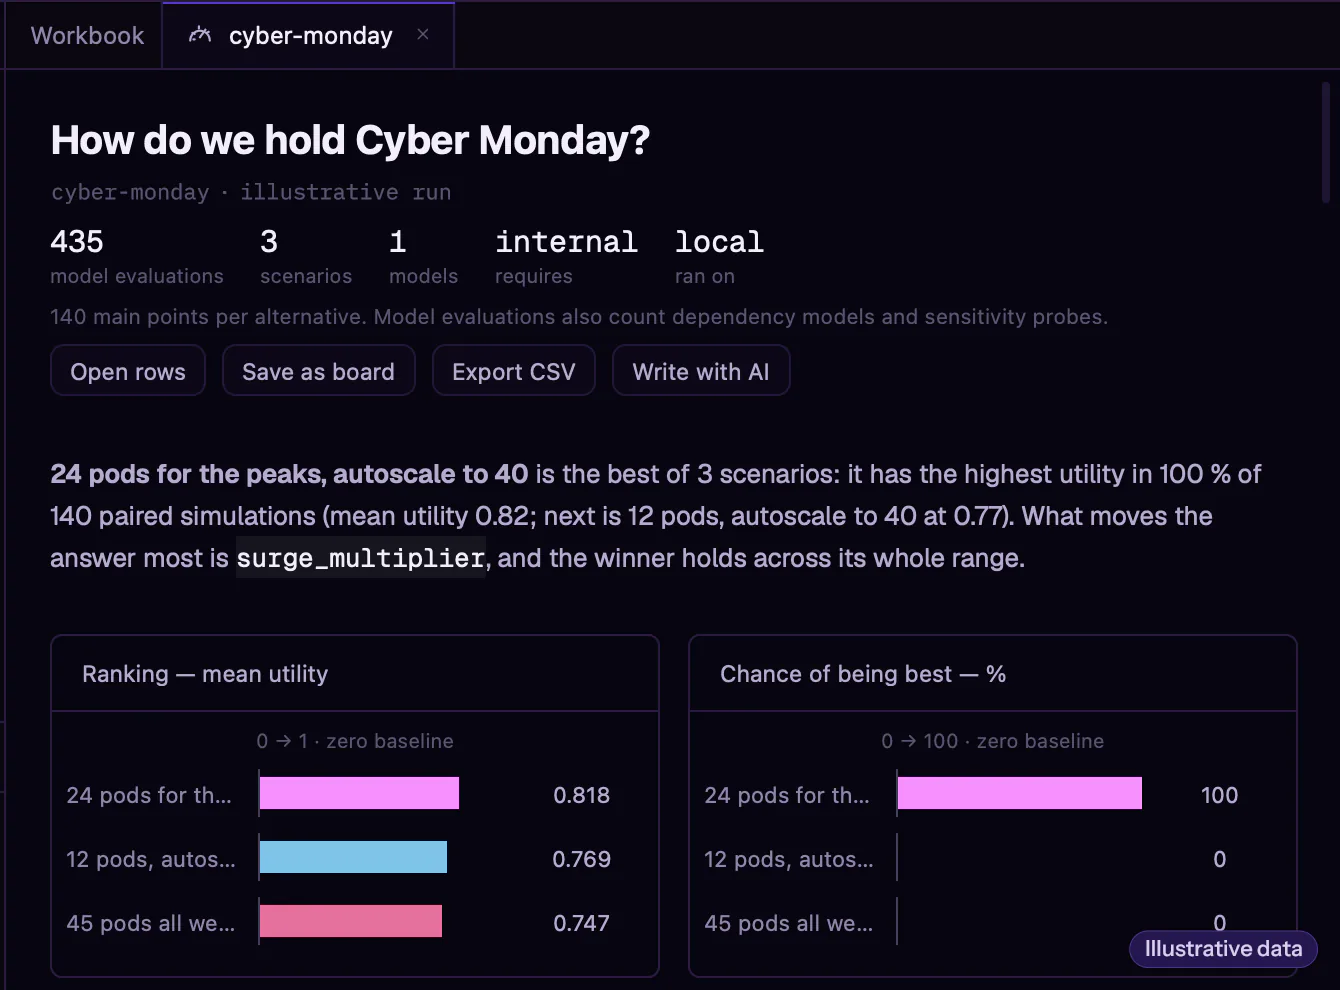
Capacity and demand forecasting for your compute estate, plus scenario simulation reconciled to your real numbers. Reproducible: the same data gives the same forecast. Forecasts you can defend to a board or an auditor, because the packet states the method, the history it ran on, and its error.
FORECASTING
Forecasts you can defend to a board.
A range, not a single number
Costs from measurement as soon as a measurement exists
Reproducible: the same data gives the same forecast
BACKTEST
The number arrives with its error.
Every forecast scored against what actually happened, on your own history
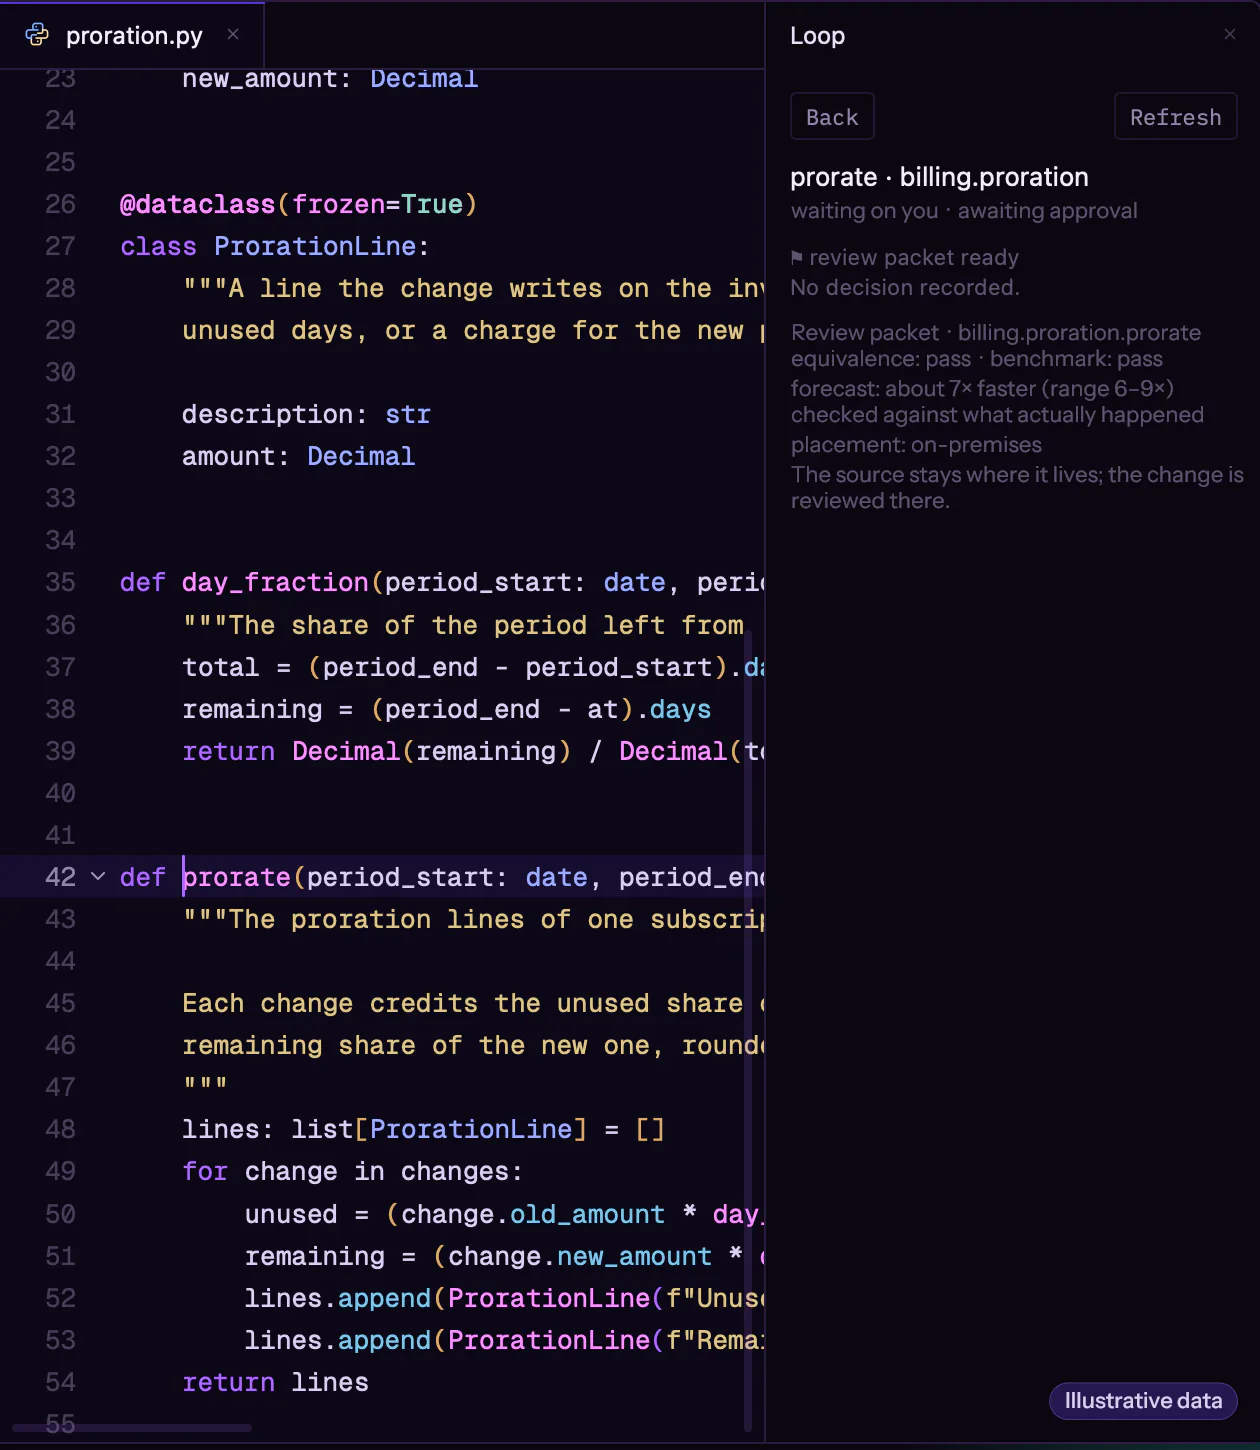
The packet states the method, the history and the error; the reviewer never takes the number on trust
A model we could not backtest on the history we hold is a model we do not ship
SCENARIOS
Scenarios reconciled to your bill.
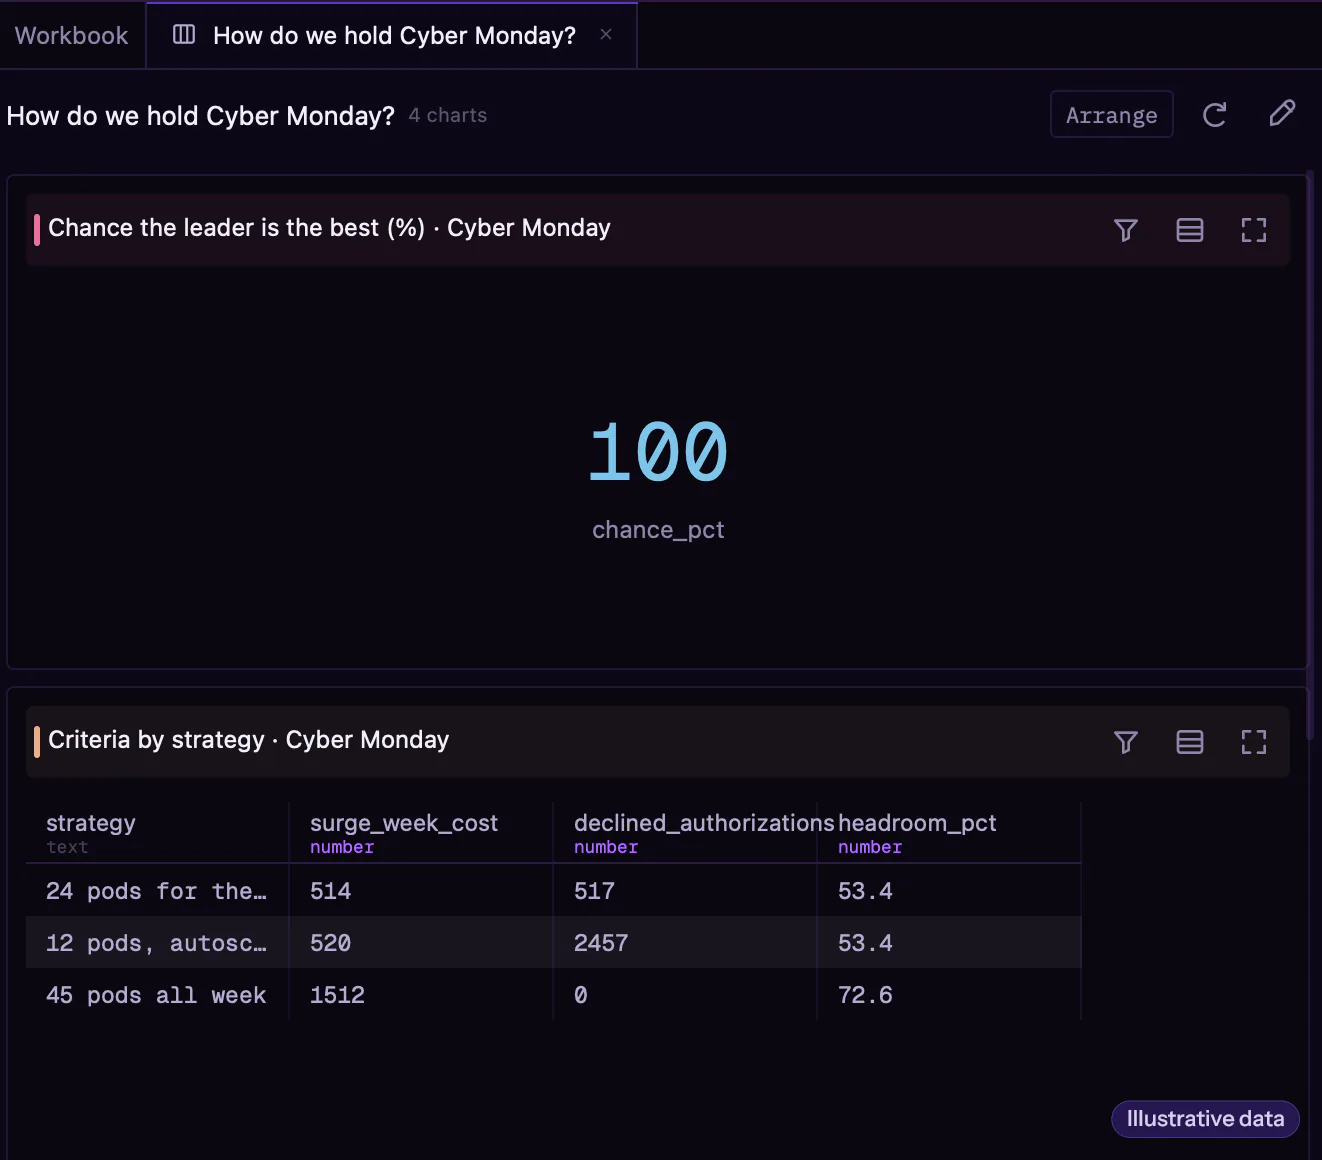
Campaign, launch, new customers: the team's assumptions next to the measured demand
See which hypotheses the data supports and which still need testing
Buy nothing until the reclaimed idle is spent
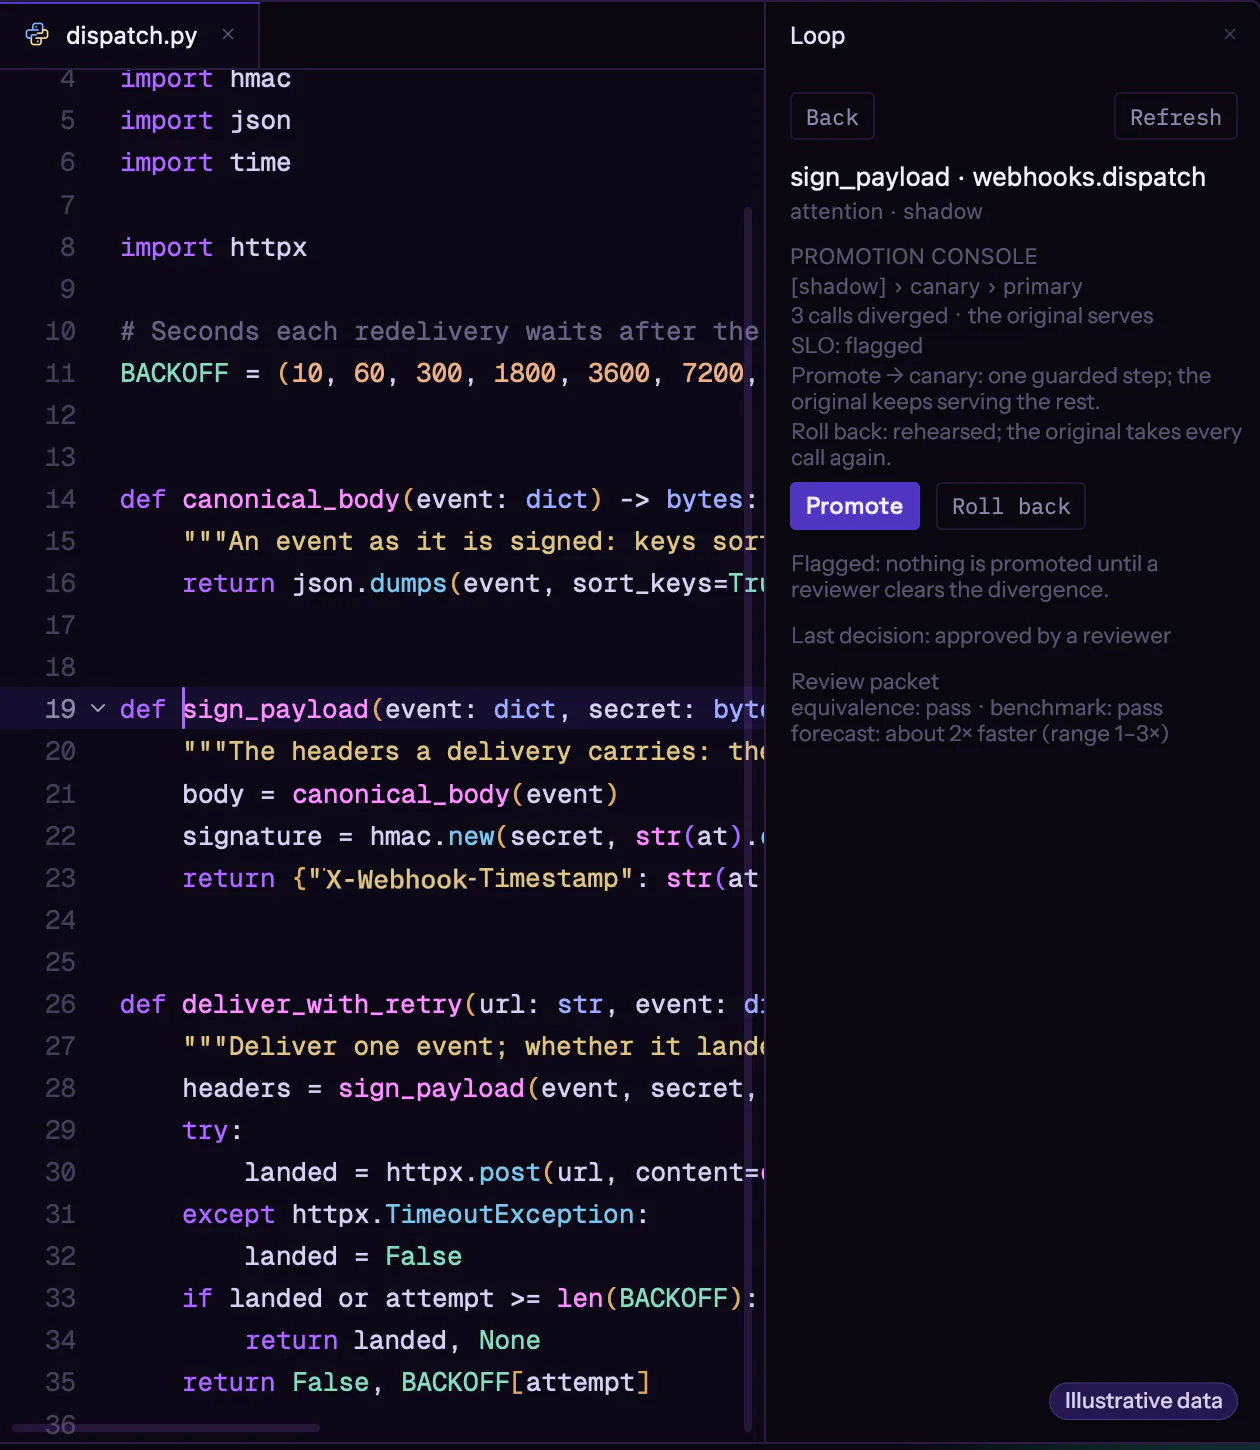
OUTCOME MONITOR
Healthy, flagged, or rolled back.
Every serving kernel judged against your SLOs, continuously
A divergence in shadow is flagged while the original keeps serving
A breach rolls back, on the record, and notifies
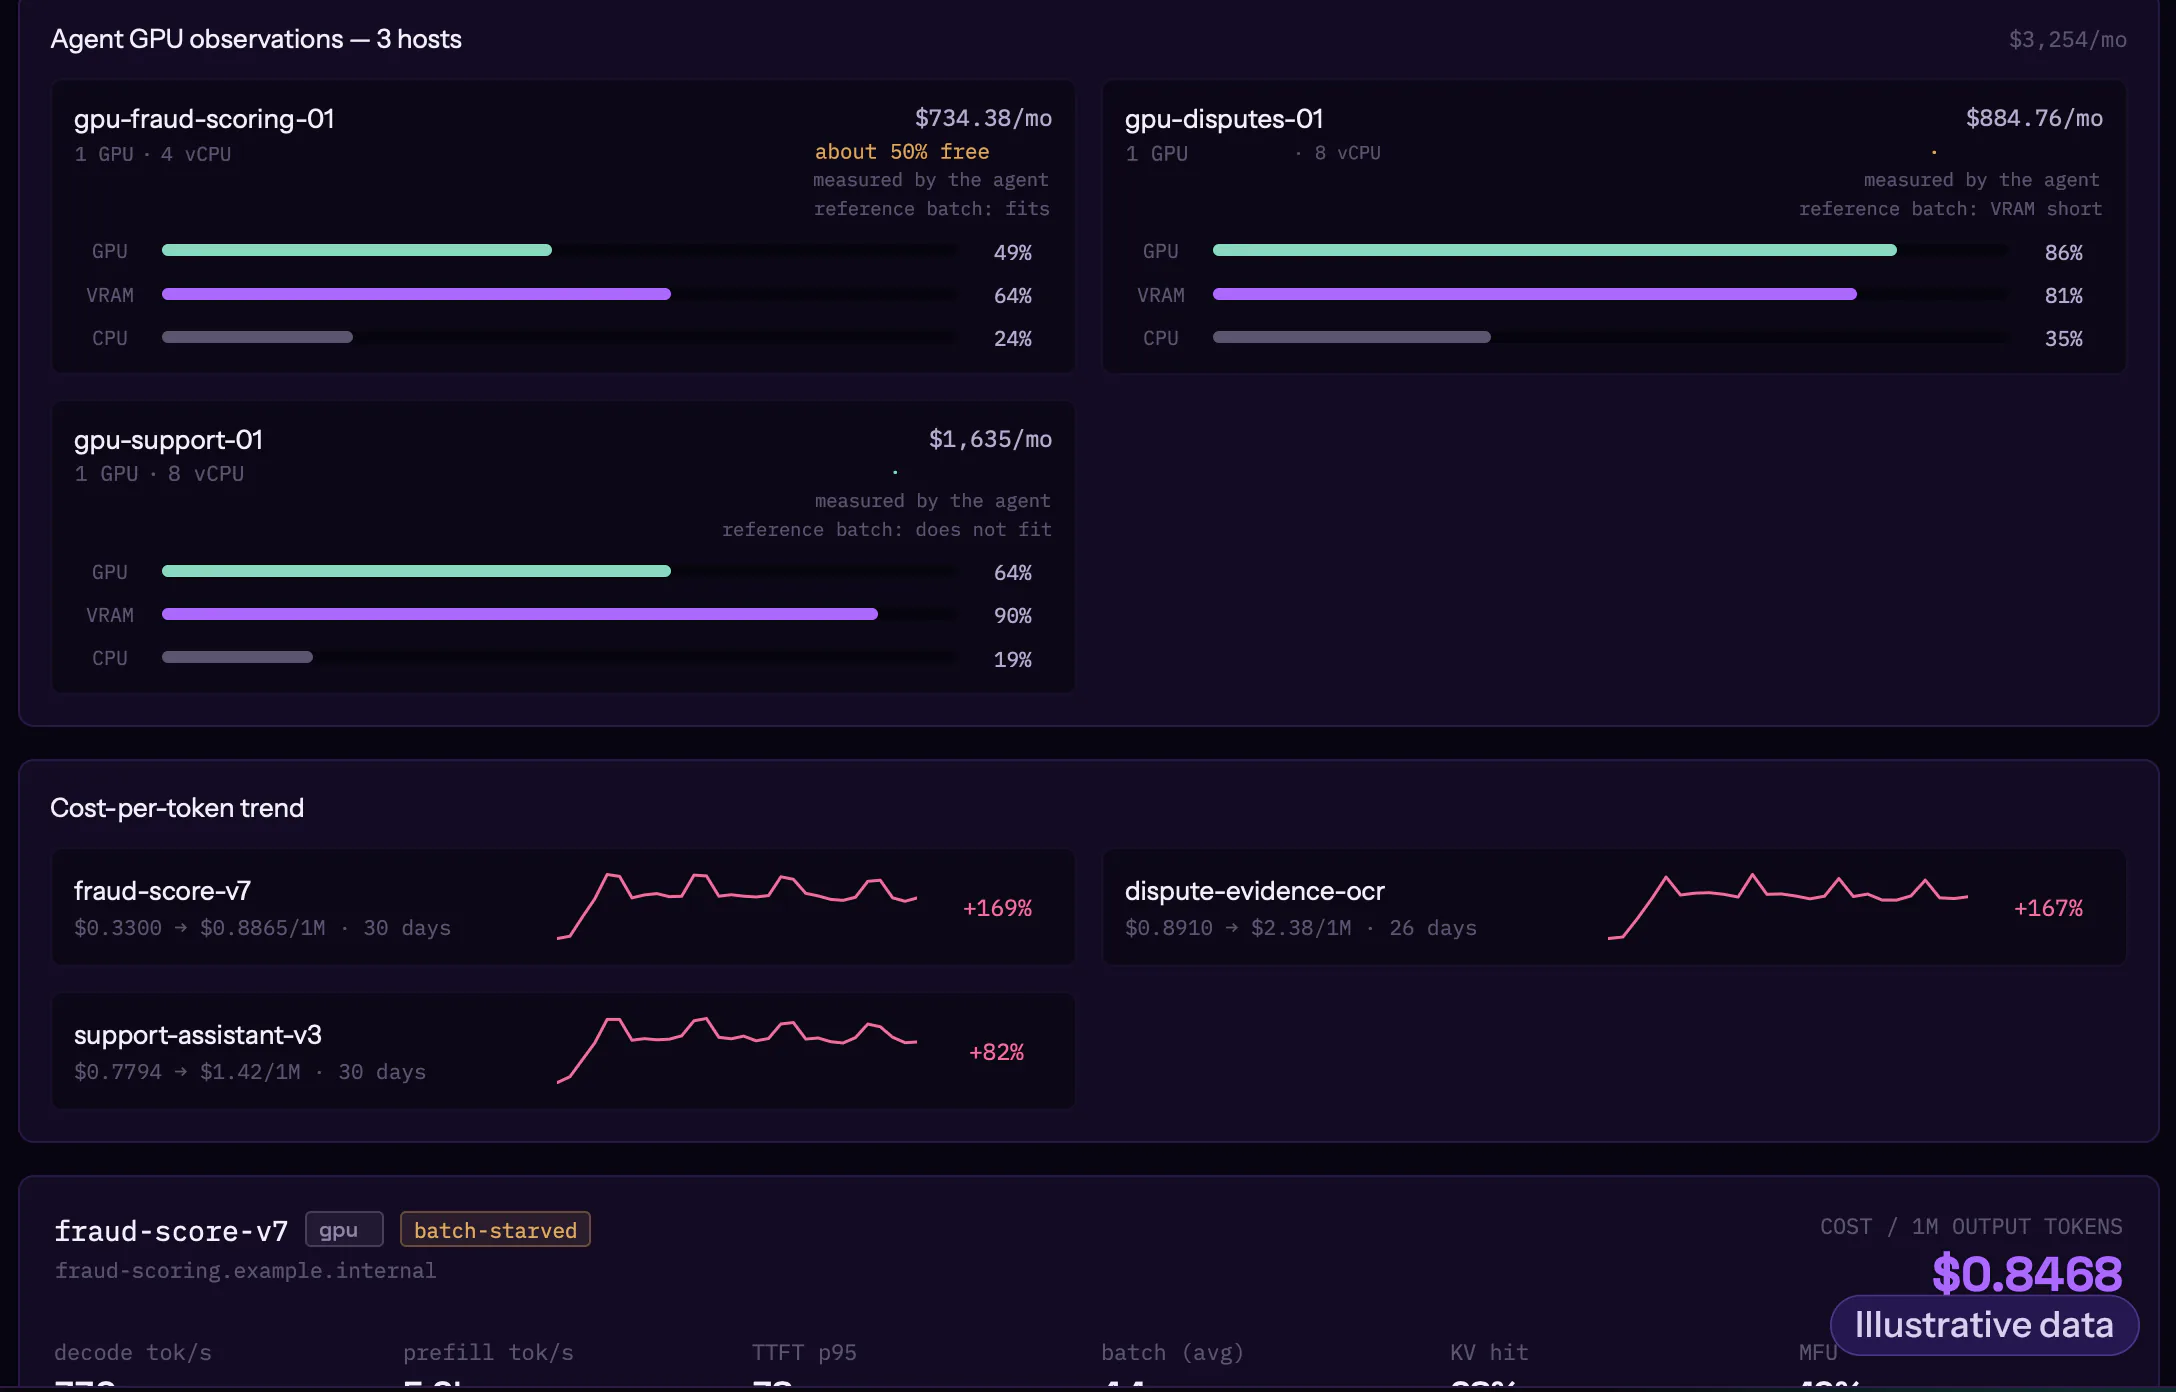
AI & GPU
Cost per token. Cost per GPU.
Inference cost attributed per model and per endpoint: cost per token, per request, per tenant
Fleet-wide GPU capacity and headroom, so you know what you can serve before you buy more
Route inference by performance per dollar and see what each decision saves
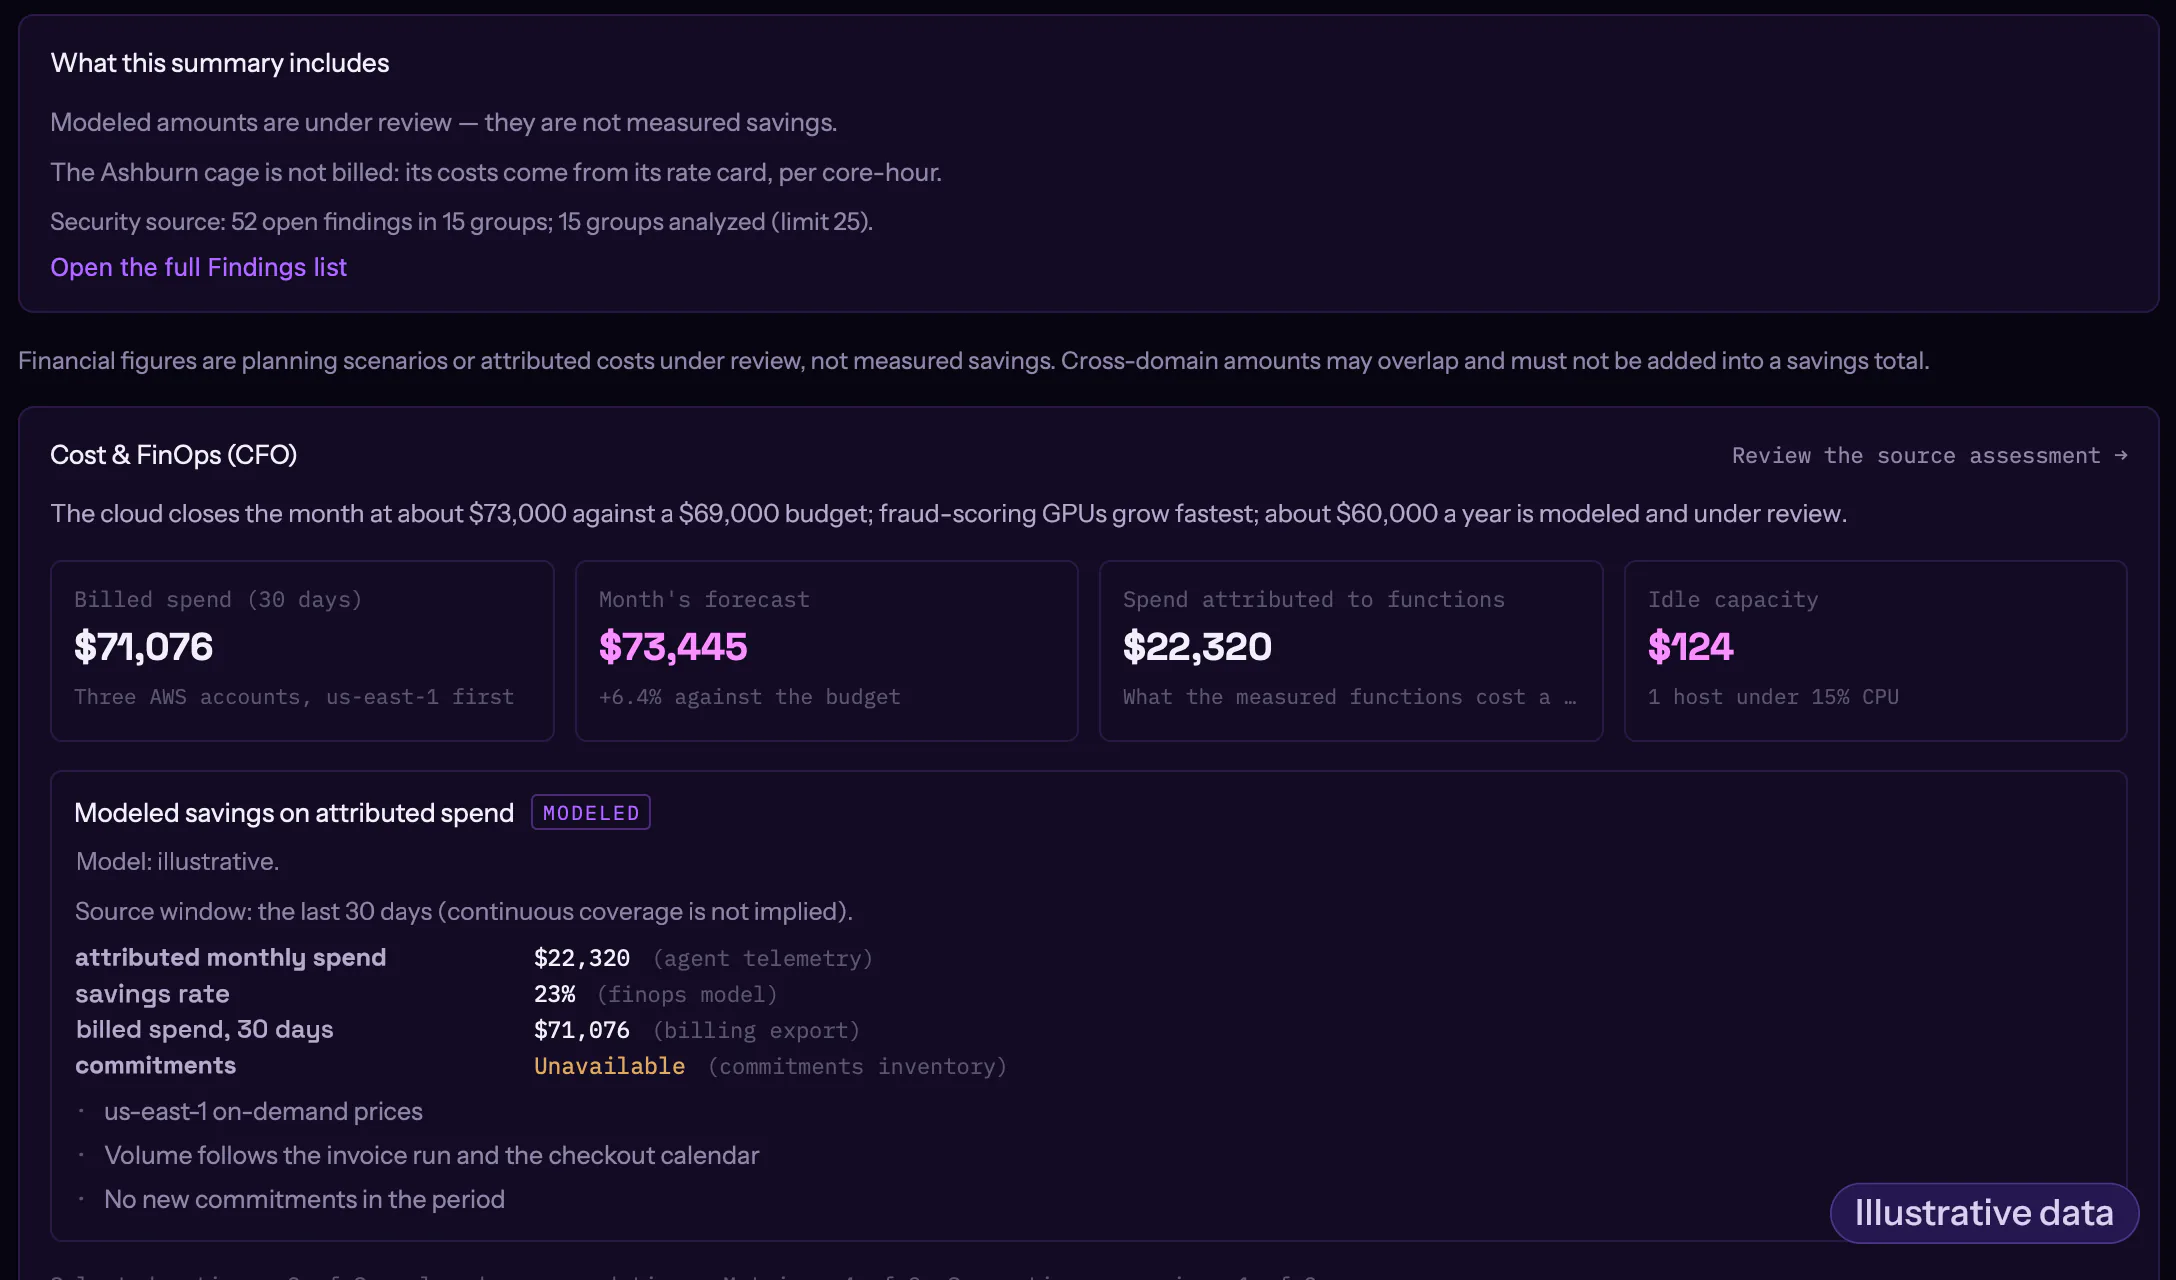
EXECUTIVE REPORT
One report, four desks.
Ranked actions per decision-maker, with the source window and the method stated
Financial figures labeled as scenarios or attributed costs, never added into a fake total
PDF on demand, with its sources
BEFORE YOU START
Before you start
What horizon?
Weeks to twelve months, with every assumption stated and the backtest attached.
Which data feeds it?
Billing, system telemetry, serving telemetry, and the projections your team provides.
Is a forecast a guarantee?
No. It is a scenario with its assumptions and its error visible. Results are measured after the change.
What's next
Start with the 48-hour assessment or bring one workload. We agree the scope in the first conversation.